Dear investors,
you should invest in crypto. Now.
I know this is an ambitious statement. And probably a hard ask nowadays.
Crypto winter was long. Sigil made -61% last year. Many funds and individual investors lost even more. Chances are you feel less wealthy than two years ago.
In 2022 we experienced a classical bust of the crypto markets. Investors felt like this:
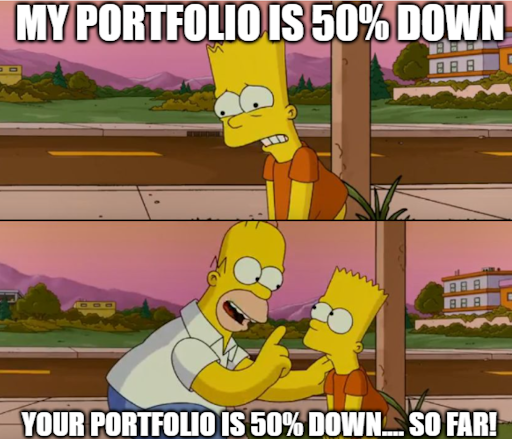
Minus 50% was not the bottom. The pain went to -61% for Sigil and -65% to -100% for many other crypto investments.
Such is the nature of the crypto cycle. Crypto markets move in 4 year cycles due to the Bitcoin halving. You always wish you sold at the previous top. And then you wish you were able to buy the previous bottom.
If you zoom out to the big picture, you are here now:
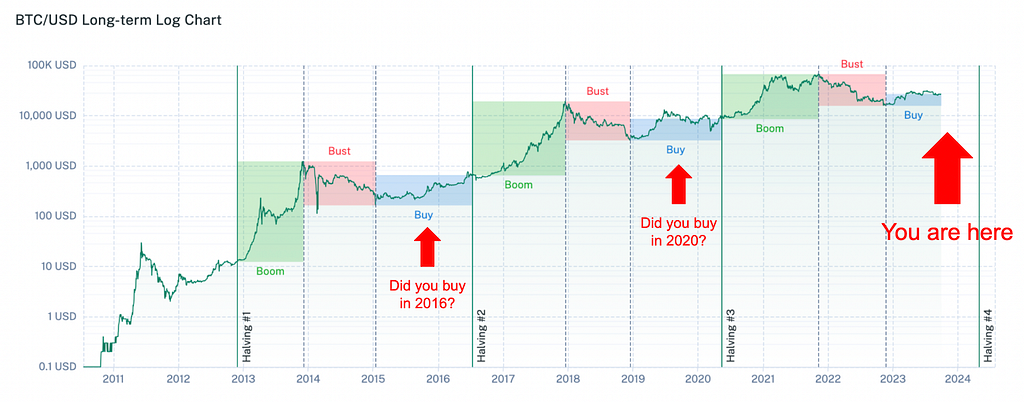
The long term trend in crypto markets is heavily influenced by the Bitcoin halving event which comes approximately every 4 years. In simple terms Bitcoin halving means that “every 4 years fewer new bitcoins are coming to the market”. Such a reduction of bitcoin supply always starts a crazy price action.
If you analyse the price action in the above chart, you’ll spot a recurring pattern. There is always a Boom phase, Bust phase and a Buy phase. Please note this is a Bitcoin (“BTC”) price chart with a logarithmic scale — so the Boom phase in 2021 peaked as high as $65,000 per BTC even if it looks like a small difference in the chart.
Why does this cycle repeat every 4 years?
Most people know bitcoin is quite volatile. But what exactly is happening in every part of the cycle? Can investors make better decisions if they pay attention to the full cycle? We think so. This is how the cycle works:
Boom phase (green)
- Bitcoin halving creates a supply shock to BTC markets every 4 years.
- Lower BTC supply inevitably leads to a BTC price increase (ceteris paribus). That´s economy 101.
- The growing price makes people excited and they pump the price even higher with speculation (this is behavioral economy 101).
- The bubble gets bigger every day.
Bust phase (red)
- Once your hairdresser or taxi driver gets excited about crypto it is a so-called “top signal”.
- It means the speculative bubble has already spread across all levels in the investment society. There is no more incremental buyer.
- People take profits. There are more sellers than buyers. The bubble pops.
- Everybody scrambles for cash and quality assets. It exposes some frauds. Leveraged trading firms go bankrupt. Lending platforms go bust. Some exchanges fail.
- People cut losses. The capitulation phase has started.
- Price only goes down.
Buy phase (blue)
- Every forced seller is out.
- Every speculator is out.
- Bankrupted firms are gone. Frauds are in jail or in the process of getting there.
- Investors who believe in crypto long term don’t want to sell at this low price.
- The bottom was found. The price doesn’t go below that anymore (this was in January 2023 in this cycle).
- The price has been stagnating for months. Or it even started slowly growing.
- Smart investors know the next Boom phase is coming and start to slowly accumulate. This is why the “Buy phase” is already slightly positive in the chart because some buyers have already frontrun the “Boom phase” opportunity.
Cool. But you want to see this with recent numbers?
Check out the past 3.5 years after the 2020 bitcoin halving:
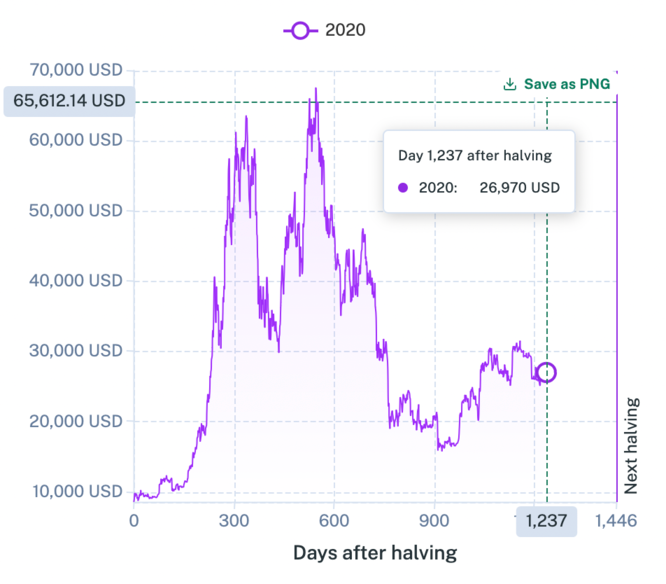
- Day 0 is Bitcoin halving day as of 11 May 2020. The boom phase lasted 550 days thereafter, from May 2020 to November 2021. BTC peaked at $66k around day 550 in November 2021.
- Then we had 450 days of a brutal Bust. BTC bottomed at $16k in December 2022.
- Since then we have been in calm territories of the Buy phase. There are 211 days left in the Buy phase. The new cycle will start with a Boom phase in April 2024.
The 4 year cycle starting in July 2016 was similar:
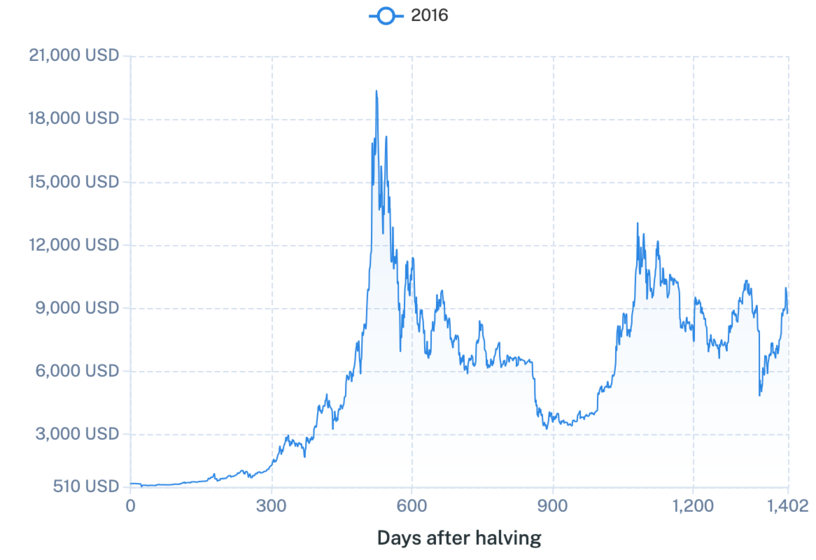
- The Boom phase peaked at $20k around Day 525 in December 2017.
- Classical 500 days of the Bust followed with BTC falling down to $3k.
- The Buy phase included a Bull trap around Day 1100 peaking at $12k because people hoped the project Libra by Facebook could help crypto markets. It didn’t happen and the Buy phase played out as usual — as an opportunity to buy before the 2020 Boom phase.
If you like even more history, check out the same 4-year pattern after the Bitcoin halving in 2012:
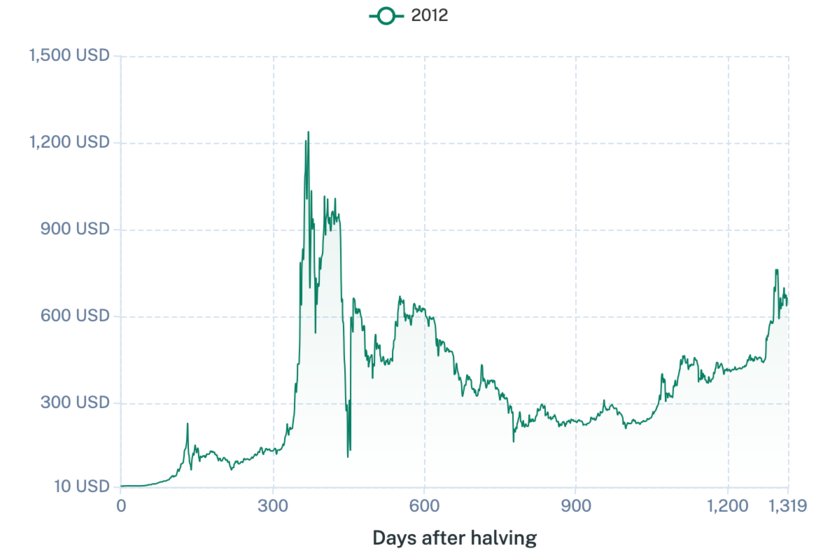
As you can see this is not rocket science. The full cycle has already repeated itself 3 times following the same pattern.
The most important practical take-away is this:
- Buying in the Boom phase can be good because growth is rapid. But if you get in too late, you risk that you buy at the peak and make -70% from there. Horrific.
- Buying in the Bust phase is driven by the idea of buying the dip or buying the perfect bottom. But the risk is you buy too early and still lose -50% from there. While the next Boom phase is still years away this can be painful.
- Buying at the Buy phase is perfect. Usually, you don’t risk more than -20% downside. And you are quite close to the Boom phase which brings big upsides. We call this an “asymmetric investment opportunity” meaning the upside is bigger than the downside.
Wait! Explain the Bitcoin halving properly.
The cycle theory makes sense. But you want to understand this Bitcoin halving part better. After all, that’s the main reason the price grows every 4 years, right?
Yes. Let’s dig in!
Let’s start from the first principles.
I. Supply shock leads to higher prices (ceteris paribus)
If you took Economy 101 courses, you will remember this chart. Reduced supply means the Supply and Demand curves meet at the point of a higher pricing:
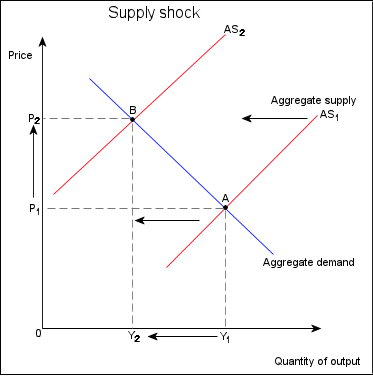
It’s common sense logic, too. The same demand chasing fewer coins means that the shiny coins are now more expensive.
Let’s have a look at how this Supply shock in bitcoin arises.
II. The Bitcoin network is powered by blockchain technology
Blockchain is simply a Chain of Blocks. If you send somebody BTC that transaction is recorded as Data in the next block. Like this:
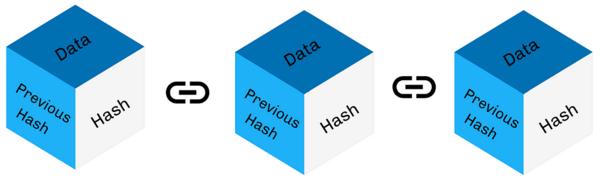
Approximately every 10 minutes there is a new block being produced in the Bitcoin network on the internet.
First bitcoin block was produced in January 2009. As I’m writing this text we are already at block 809,729.
You may be wondering what the “Hash” in the picture means? The Hashing part — a cryptographic calculation that requires big computing power — is done by computers that support the Bitcoin network in a decentralized process. These computers are called “the miners”. When these guys calculate the hash, the block is produced.
III. Every block also creates new bitcoins that are given to miners
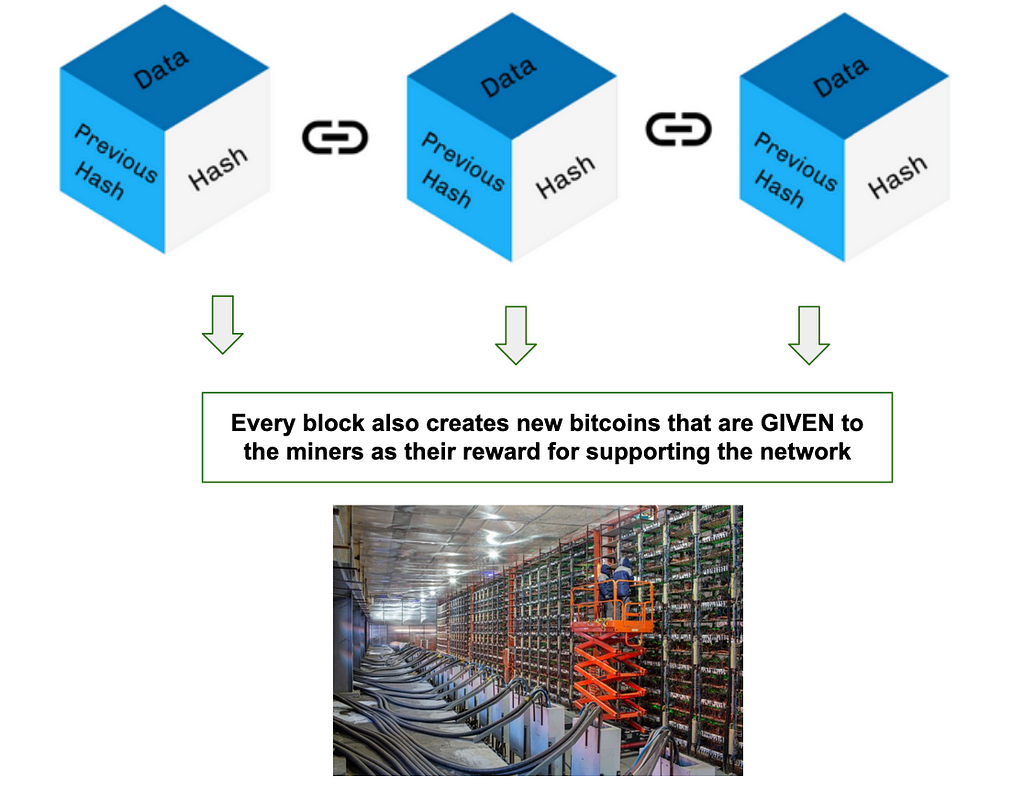
With every block 6.25 new BTC gets minted and given to miners for supporting the network. That’s a lot of money given to miners in BTC, right? Yes, but their reward gets reduced every 4 years in the halving events.
The reward will be reduced to 3.125 BTC per block in the next “halving event” in April 2024. Now you get the sense of what “halving” means. It means BTC rewards to miners are cut by half (roughly) every 4 years.
These are the dates of past and future BTC halvings:
- 28 November 2012
- 9 July 2016
- 11 May 2020
- 25–26 April 2024 (estimated), exact date depends on how fast the miners find blocks
Bitcoin halving has been programmed into the Bitcoin protocol. It is a very interesting topic and you may want to read more about it. But for our purposes we are fine with understanding that the halving comes (roughly) every 4 years and reduces the supply of new bitcoins by 50%.
IV. The only available supply of new bitcoins comes from Miners selling new BTC
Miners are operators of hardware facilities (like in the picture above) who burn electricity and computers in order to receive the BTC rewards. Miners receiving the bitcoin reward is the one and only method of how new bitcoins come to existence.
What do you think miners do when they receive bitcoins?
Their business is running a computing warehouse. Their costs are electricity and hardware expenses. They need dollars to pay these costs.
Their revenue is the BTC reward. So they mostly sell BTC to the market.
Source: https://bitcoin.stackexchange.com
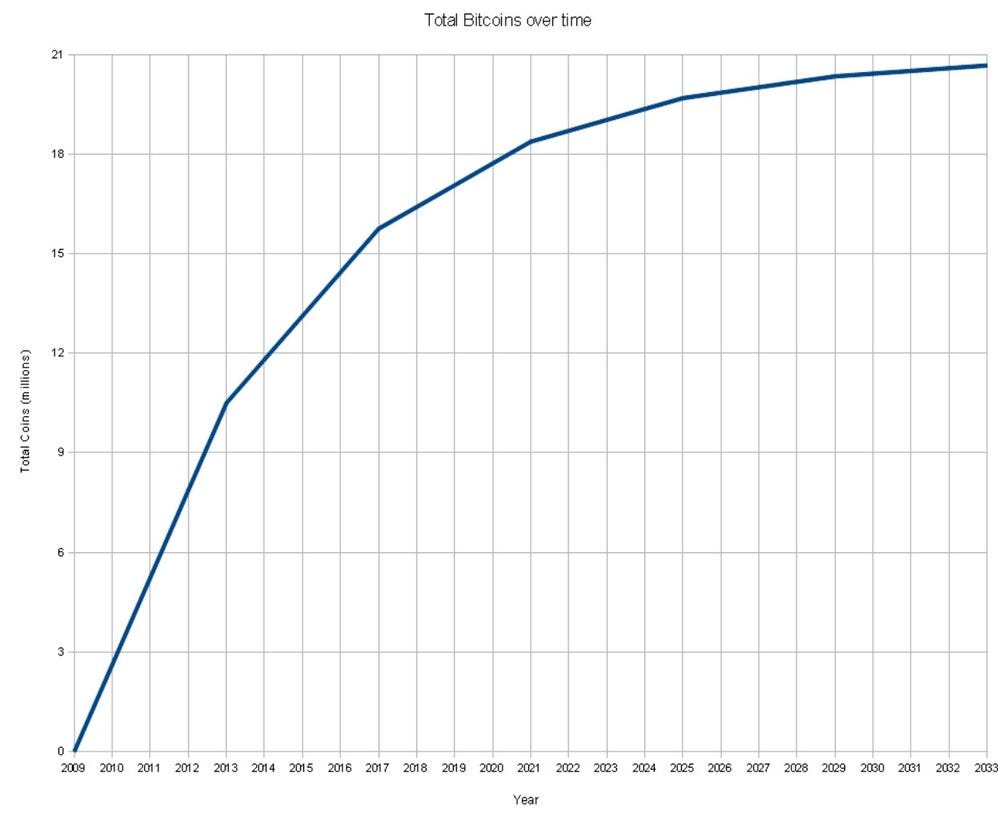
Take away: The supply of new bitcoins is coming only from the miners. There will be a maximum of 21m bitcoins in existence. Currently we are at 19,499,112 bitcoins circulating in the market (as of 29 September 2023). Roughly every 10 minutes new bitcoins are issued. But roughly every 4 years the supply of new BTC is reduced by half. You can see the new bitcoins will only become more scarce in the future.
V. Case study: Supply vs Demand post BTC halving in May 2020
Now you understand the supply part of the BTC market.
Let’s dig deeper and try to simulate a Demand part of the equation to see what this means for price. This is our case study based on 2020 data:
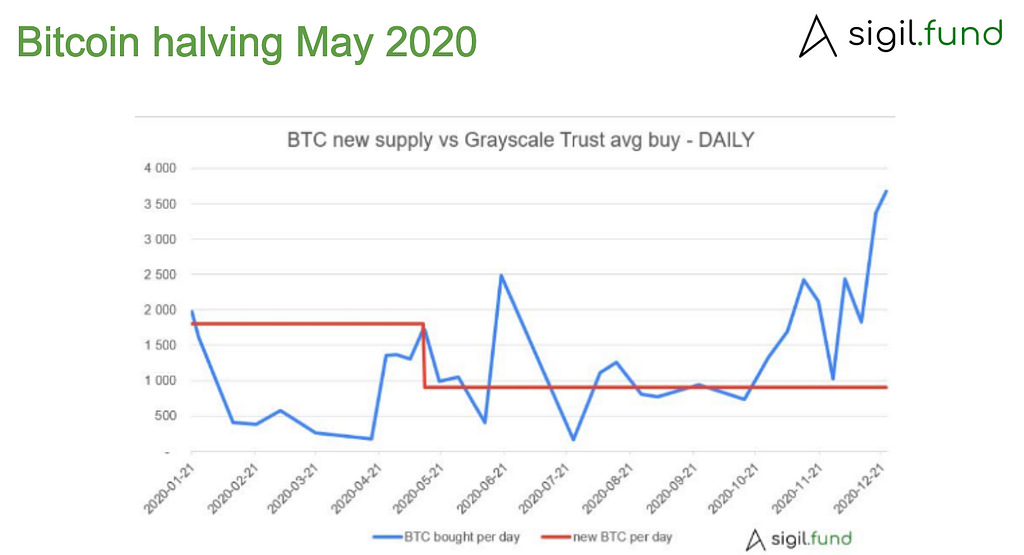
In the above chart you can see:
- The red curve is the Supply of new BTC. That’s easy.
- Before May 2020 there was around 1,800 new BTC per day coming into existence. Approximately every 10 minutes the block was produced and rewarded miners with 12.5 BTC. That’s 75 BTC per hour. 1,800 BTC per day.
- After the halving in May 2020 you can see the supply shrank to 900 new BTC per day. Miner rewards were cut in half.
- The blue curve is the Demand of one institution — The Grayscale Bitcoin Trust — historically the largest buyer of BTC in the US market. We did primary research on their SEC filings and reconstructed their demand curve over time.
- As you can imagine the real global demand is MUCH higher. Add all crypto funds. Add all companies like Tesla or Microstrategy who diversified their treasury into BTC. Add all retail investors.
Take away: Interestingly, after the BTC halving in 2020, one institutional buyer has been buying more than the whole global supply of new BTC. That means a lot of the existing BTC must have been bought in the spot and derivative markets, resulting in the BTC price booming up.
Some people think the BTC price action is driven only by speculation. Hopefully you can appreciate how that´s not true. The halving events are coded into the bitcoin protocol as a law. And the price starts moving due to the supply shock in a way that’s fully in line with scientific models explained in Economics 101.
But let’s get back to the numbers and current cycle.
Are we entering the growth territory again?
Yes.
In fact, we are already in the growth year:
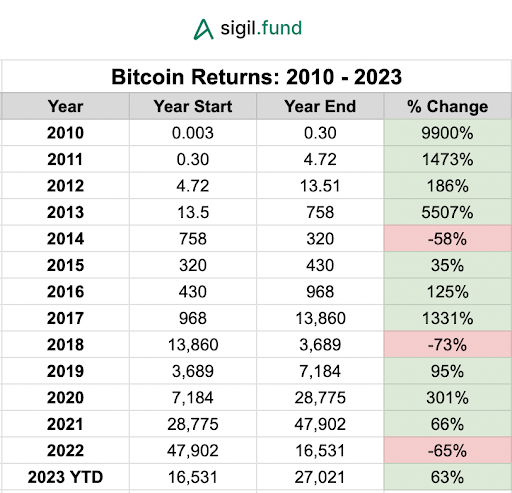
Bitcoin usually has 3 good years and then 1 bad year. One of these good years brings sizable returns to investors — that’s the Boom phase year.
But what about Macro?
The world is different now than it was 4 years ago. What if it’s different this time due to macro? What if the Boom phase is not coming? When is a good time to invest?
These are some of the most frequent questions we are hearing from investors. How to form a high conviction hypothesis in this crazy world and in such a volatile market? We have to rely on current data, investor experience and try to make rational decisions with information that is available to us.
- In the past cycle macro was extremely accommodative because of the global covid crisis. Monetary policy was extreme easing. We can’t expect such monetary tailwinds again unless another global crisis happens. On the other hand, 2022 brought extreme monetary tightening which totally busted the markets. It’s easier to make big returns from here as BTC is still around -60% below its previous top. The new Boom phase has always introduced a new all time high, so the potential is great from here.
- In 2023 inflation concerns are mostly contained and there won’t be further extreme macro tightening. The indebted global economy is at risk of systemic collapse at the FED rates above 6%. We are already at 5.5%. Perhaps macro will be neutral going forward. Or it could get slightly positive in the next 2 years because the indebted system is addicted to cheap money. Either is fine for crypto.
- Furthermore, there is one bullish catalyst that may dwarf all other considerations. The ETFs are coming. BlackRock applied for a spot BTC ETF. BlackRock, the world’s largest wealth management company, only had one rejection of their ETF applications in their entire lifetime. They have 422 ETFs tradable on the US market. There is a spot BTC ETF application from Fidelity, too. TradFi is entering crypto. The ultimate deadline for the approvals is until the end of Q1 2024. Perfectly aligned with the next Bitcoin halving.
The Exchange Traded Funds (ETFs)
ETFs are funds that trade on an exchange like a stock. A spot bitcoin ETF tracks the price of bitcoin by holding physical bitcoins in the portfolio. It makes it significantly easier for a broader range of investors (especially big institutional players) to gain exposure to bitcoin in a fully regulated fashion without needing to buy or store the cryptocurrency themselves.
ETFs are huge. See how the first gold ETF impacted the gold market:
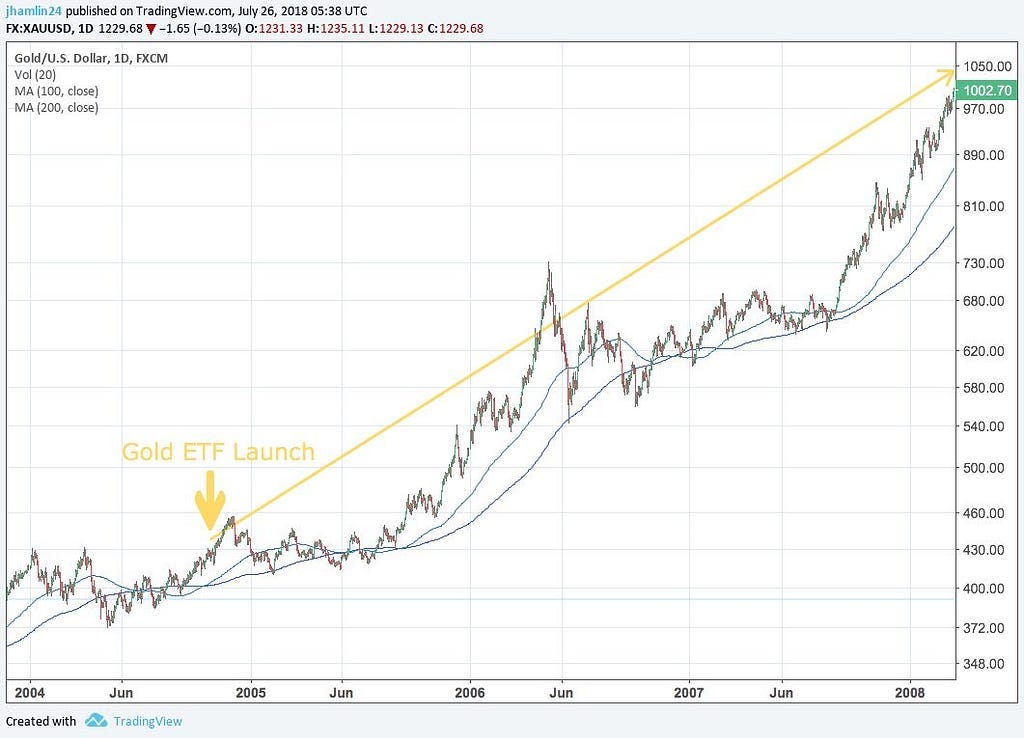
Think about it this way — after the BTC ETFs by BlackRock and Fidelity are available, every financial institution will agree the asset class is now safe enough and regulated enough for them to enter. Pension funds will get involved.
Global top 300 pension funds manage $20.6 trillion of wealth and they need to produce returns somewhere. The pension funds will enter crypto once Blackrock and Fidelity offer them the spot ETFs.
The Bitcoin market cap is only around $0.5 trillion. If these pension funds allocate 5% of their portfolios, that would represent $1 trillion of new demand coming into the crypto market that is growing anyway due to its natural 4 year cycle. A perfect storm.
What about the rest of the crypto markets?
The investment strategy of Sigil Core fund is much broader than just Bitcoin investments. Our focus is on the whole web3 space. We want to find winners in every industry that will use blockchain technologies at scale. We invest in web3 startups with a more dynamic growth profile (and risk profile) than BTC.
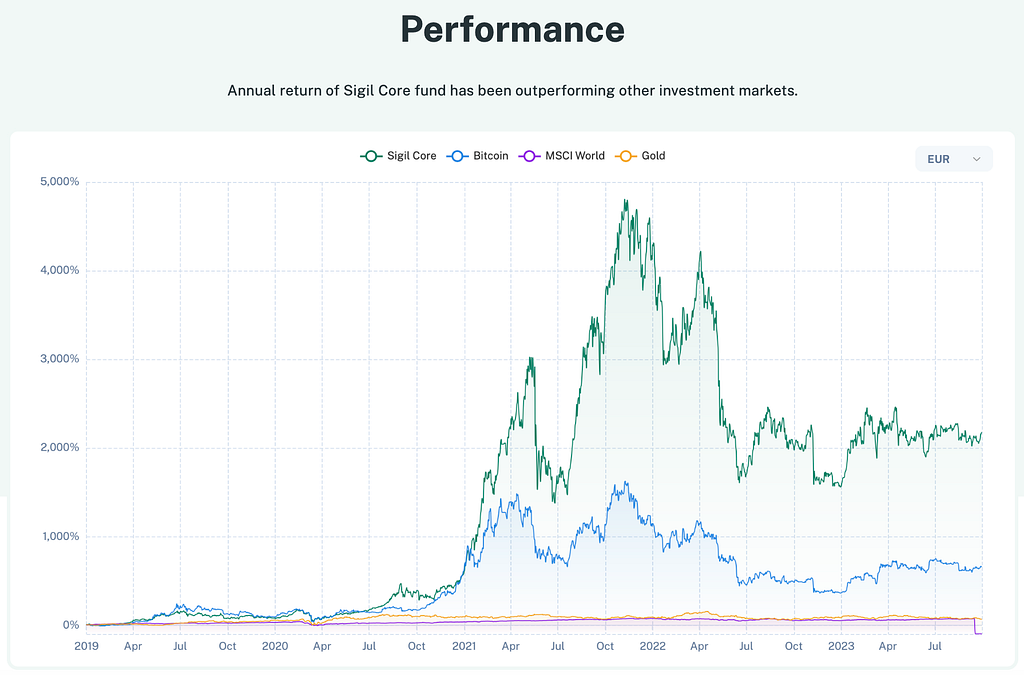
Over the past 5 years our investors made significantly higher NET returns (after fees) than if they invested in BTC. If you invested 100,000 EUR in January 2019, you’d have:
- around 600k EUR if you invested in BTC
- around 2m EUR if you invested in the Sigil Core fund
Investing into a well established regulated fund is also more convenient than buying crypto directly — you don’t need to store it and manage it. We are a regulated financial institution following the same compliance requirements as your bank, so there is no problem cashing out into your bank. In some cases investing into a fund is also more beneficial from a tax perspective (compared to buying a commodity such as BTC).
Conclusion
Hopefully, this article helped you understand why it is a strong idea to invest in crypto now.
- BTC halving is coming.
- The 4 year crypto cycle is moving to its growth territory.
- Spot ETFs are once in a lifetime growth catalyst for the crypto asset class. The impact can be significant.
- You may have heard the news about Ethereum improvements, scaling blockchains and more technical news that strengthen fundamentals of the crypto markets. These will fuel the next bull cycle, too. We regularly talk about these developments in our blog section.
Best investment decisions always feel a little uncomfortable. But if you have good knowledge about what is coming in the future, you can gain more conviction about your hypothesis. Investing in the Buy phase is rational. Investing during the Boom phase often feels easier (your sentiment is higher) but it is a tricky timing, which may lead you to losses.
Please share this article with your friends. It may help them to get an idea of how the crypto market works. Hopefully, thanks to this article, they will avoid some of the common mistakes — like buying at the late Boom phase. You don’t want your friends to be a top signal :)
Bonus content — interactive charts
Our developers pulled together two interactive charts about BTC cycle and BTC halving. The charts automatically update themselves every day. So you can come back to this article and check where we are and if the cycle is playing out as expected.
BTC/USD Long Term
Bitcoin Price After Halvings
Thanks for your ongoing trust in Sigil Fund!
Pavel, CEO
Read more about our investment strategy and about the Sigil fund.
Disclaimer: Invest responsibly. Don’t use leverage. The above analysis represents investment views of the author and should not be interpreted or relied on as financial advice.